Grafana Installation Guide
For server administrators opting for standalone binary instances instead of automated setups, execute the following secure hardening steps to deploy Grafana version 13.0.1+security-01.
Monitoring Stack Topology
1. Download & Extract
Acquire the hardened Linux 64-bit package and expand it to the server file system:
download grafana:
wget https://dl.grafana.com/grafana/release/13.0.1+security-01/grafana_13.0.1+security-01_25720641773_linux_amd64.tar.gz
Optional: If you require a different version or architecture, you can obtain the latest download links from the Official Grafana Download Portal.
extract package:
tar -zxvf grafana_13.0.1+security-01_25720641773_linux_amd64.tar.gz
output:
grafana-13.0.1/
grafana-13.0.1/bin/
...
2. System Security Group & User
Isolate the Grafana runtime by provisioning a dedicated system user configured without login capabilities:
create user:
sudo useradd -r -s /bin/false grafana
3. Installation & Core Permissions
Migrate the binary hierarchy into safe execution pathways (/usr/local) and institute fundamental recursive ownership constraints:
move binary to system path:
sudo mv grafana-13.0.1+security-01 /usr/local/grafana
set permissions:
sudo chown -R grafana:users /usr/local/grafana
copy sample configuration:
sudo cp /usr/local/grafana/conf/sample.ini /usr/local/grafana/conf/grafana.ini
4. Systemd Service Unit Definition
To authorize daemon oversight, process supervision, and startup perseverance, register the service via systemd:
create service file:
sudo tee /etc/systemd/system/grafana-server.service <<EOF
[Unit]
Description=Grafana Server
After=network.target

[Service]
Type=simple
User=grafana
Group=users
ExecStart=/usr/local/bin/grafana server --config=/usr/local/grafana/conf/grafana.ini --homepath=/usr/local/grafana
Restart=on-failure

[Install]
WantedBy=multi-user.target
EOF
5. Initialization & Lifecycle Activation
Grafana generates critical run-time directory architectures (e.g., /usr/local/grafana/data) during its initial runtime. Run the process manually once, stop it, ensure permissions are reapplied, and then fully activate the daemon:
run once for initialization:
sudo -u grafana /usr/local/grafana/bin/grafana server --homepath /usr/local/grafana
Troubleshooting: If you encounter a permission denied error while creating the SQLite database, ensure you are running the command as the grafana user using sudo -u grafana.
output:
INFO [05-15|23:28:18] Creating SQLite database file            logger=sqlstore path=/usr/local/grafana/data/grafana.db
...
logger=settings t=2026-05-15T23:07:00Z level=info msg="Starting Grafana" ...
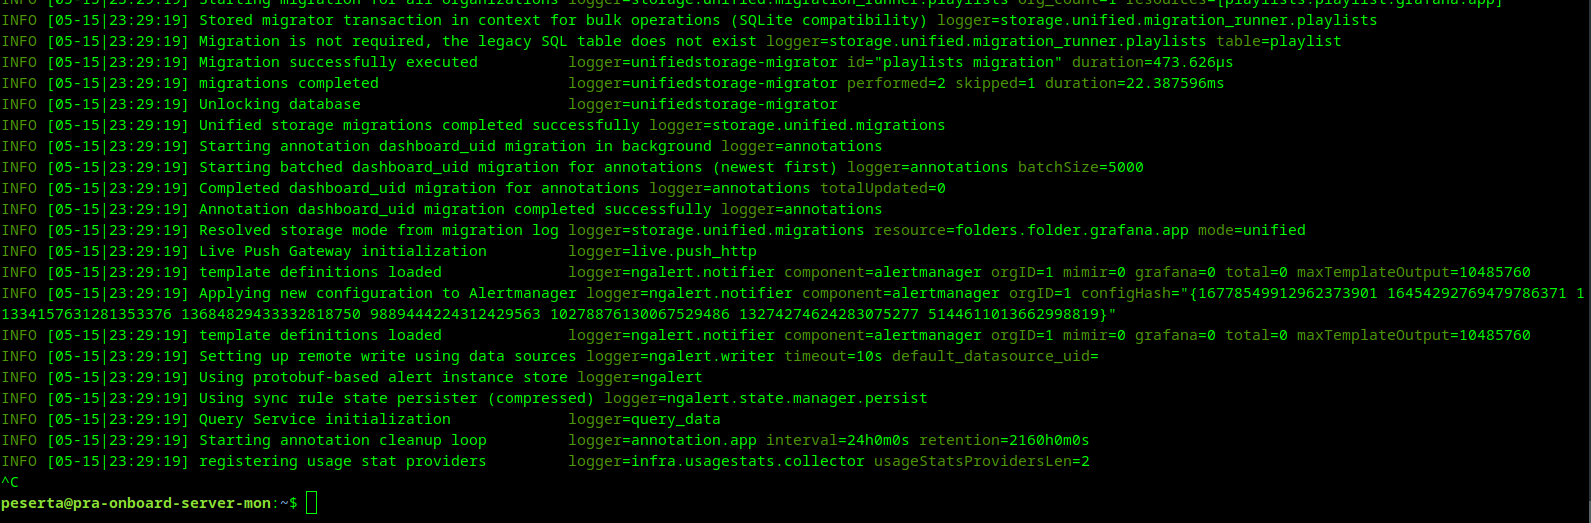
Observe terminal log stream output confirming successful bootstrapping, then terminate the task using CTRL + C.
Once directory generation resolves, finalize system controls:
finalize permissions:
sudo chown -R grafana:users /usr/local/grafana
reload systemd:
sudo systemctl daemon-reload
start service:
sudo systemctl start grafana-server
enable service:
sudo systemctl enable grafana-server
Verification
Verify active service operational status and bind ports:
check service status:
sudo systemctl status grafana-server
output:
● grafana-server.service - Grafana Server
   Loaded: loaded (/etc/systemd/system/grafana-server.service; enabled; vendor preset: enabled)
   Active: active (running) ...
The Grafana Administrative Suite can now be queried over standard HTTP mapping. Default credentials can be changed upon your initial sign-on routing.
6. Cloudflare Tunnel Setup (Optional)
Note: This section is only necessary if your server does not have a public IP address or if you are behind a restrictive firewall/NAT and need to securely expose Grafana to the internet.
To securely expose Grafana to the internet with high availability, configure cloudflared as a background system service.
A. Install Cloudflared
Download and install the official Cloudflare Tunnel daemon:
download cloudflared:
curl -L --output cloudflared.deb https://github.com/cloudflare/cloudflared/releases/latest/download/cloudflared-linux-amd64.deb
install package:
sudo dpkg -i cloudflared.deb
B. Authenticate & Create Tunnel
Log in to your Cloudflare account and create a tunnel for this server:
login to cloudflare:
cloudflared tunnel login
create tunnel:
cloudflared tunnel create btech-grafana
output:
Tunnel credentials written to /home/peserta/.cloudflared/953e627c-62fa-4656-9a4e-0465a5da4724.json.
Created tunnel btech-grafana with id 953e627c-62fa-4656-9a4e-0465a5da4724
C. Configure Routing & Persistence
Create a system-level configuration to map your domain to the local Grafana instance.
create dns record:
cloudflared tunnel route dns btech-grafana btech-grafana.paha.my.id
scaffold configuration directory:
sudo mkdir -p /etc/cloudflared
copy credentials to system path:
sudo cp /home/peserta/.cloudflared/<ID>.json /etc/cloudflared/
create config file:
sudo tee /etc/cloudflared/config.yml <<EOF
tunnel: <ID>
credentials-file: /etc/cloudflared/<ID>.json

ingress:
  - hostname: btech-grafana.paha.my.id
    service: http://localhost:3000
  - service: http_status:404
EOF
install & start service:
sudo cloudflared --config /etc/cloudflared/config.yml service install
sudo systemctl start cloudflared
sudo systemctl enable cloudflared
Verification
Check the status of the tunnel service:
check tunnel status:
sudo systemctl status cloudflared
output:
● cloudflared.service - cloudflared
   Loaded: loaded (/etc/systemd/system/cloudflared.service; enabled; vendor preset: enabled)
   Active: active (running) ...
7. Grafana Onboarding
Once Grafana is successfully exposed, you can begin the onboarding process through your domain.
A. Initial Login
Navigate to your Grafana instance (e.g., https://btech-grafana.paha.my.id/login). You will be presented with the standard login portal.
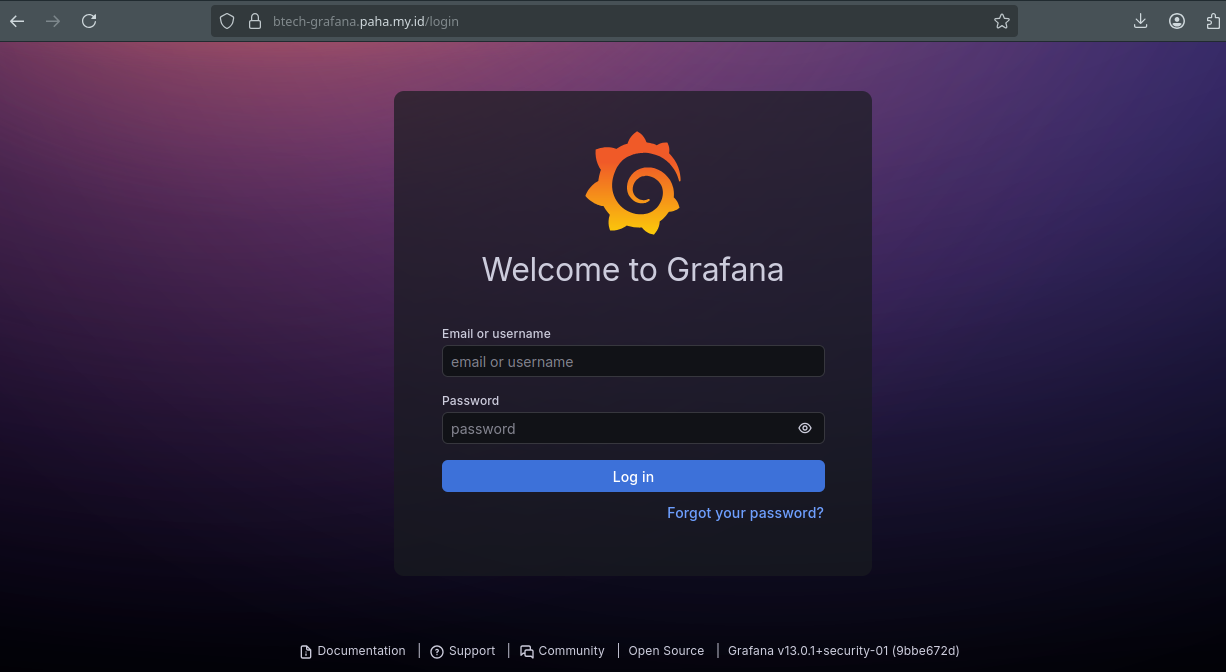
Use the default administrative credentials:
- Username:
admin - Password:
admin
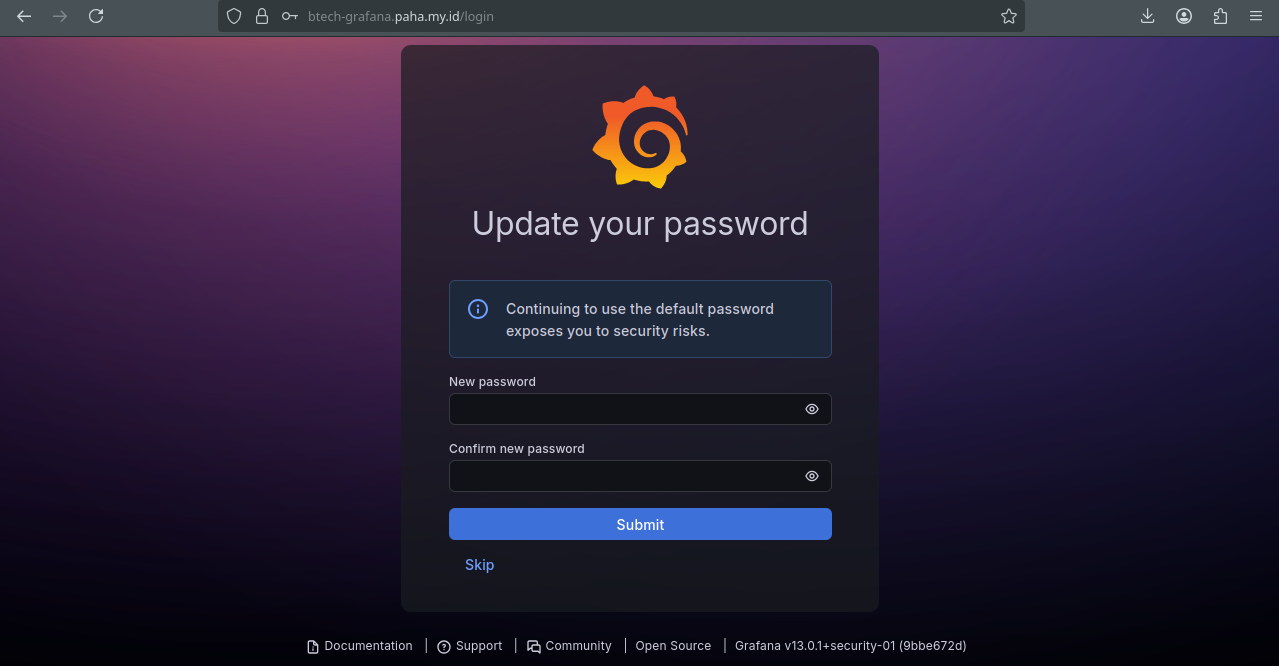
B. Security Hardening (Password Change)
Upon your first successful login, Grafana will immediately prompt you to replace the default password with a secure, unique alternative.
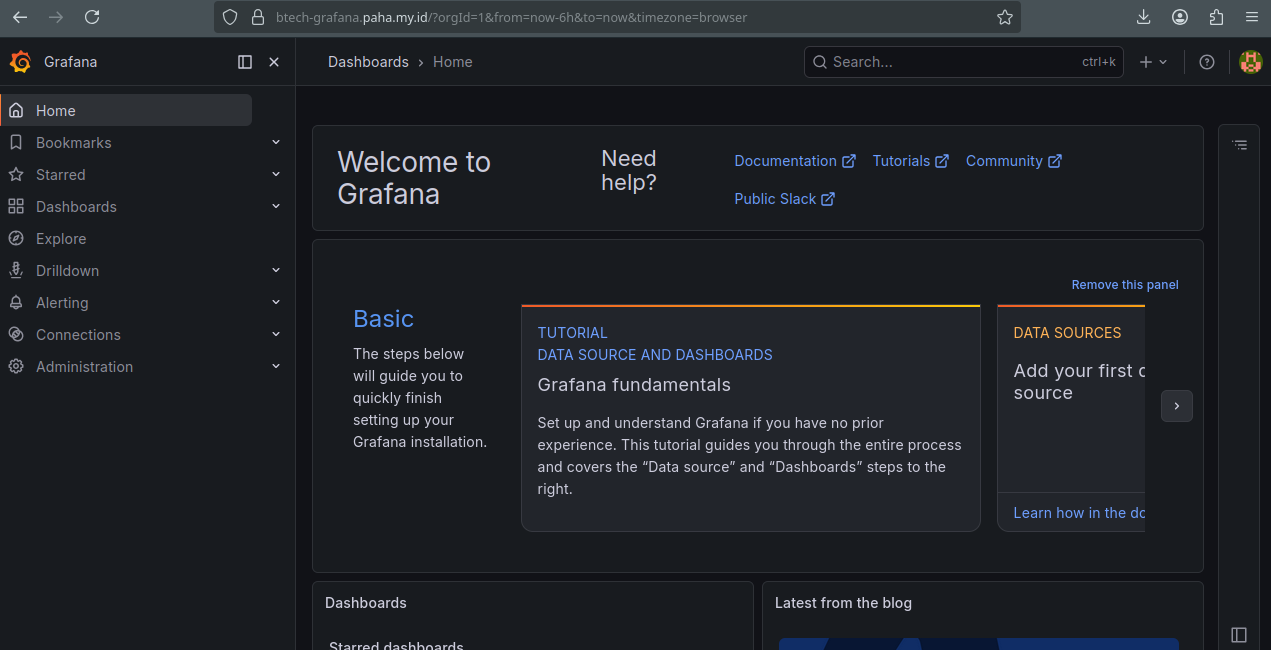
C. Explore the Dashboard
After securing your account, you will reach the Grafana Home Dashboard. From here, you can begin adding data sources (such as Prometheus and Loki) and building your monitoring visualizations.
8. Data Source & Dashboard Configuration
To visualize system metrics and logs, you must connect Grafana to your data providers and import pre-configured dashboards.
A. Prometheus
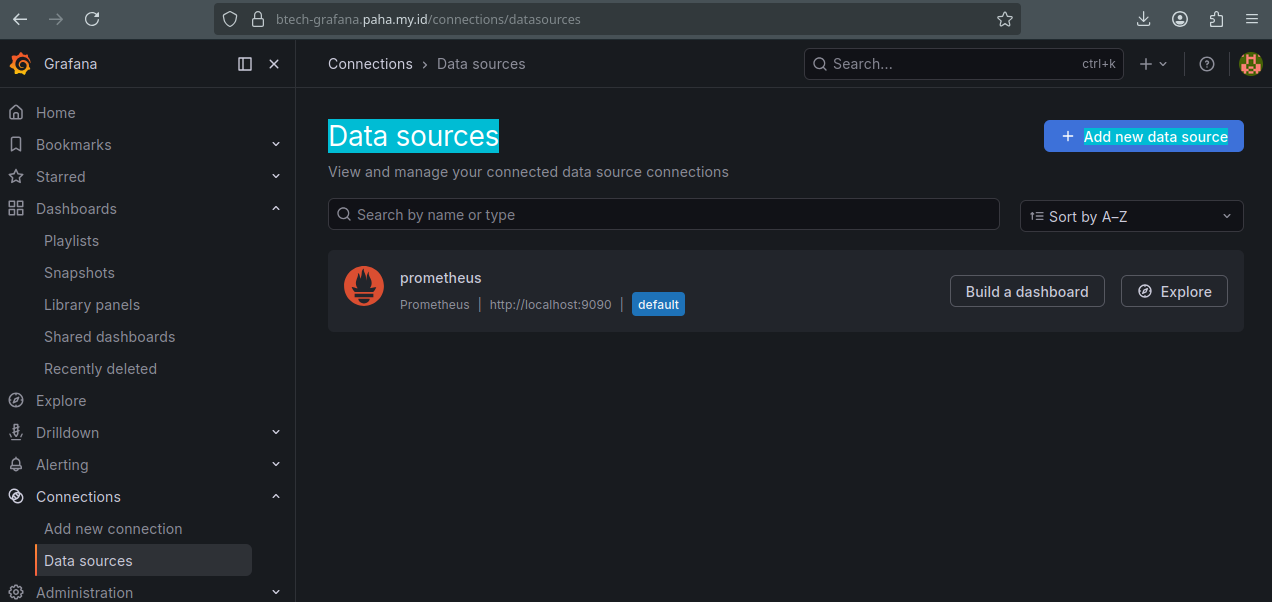
1. Add Prometheus Data Source
- Navigate to Connections > Data Sources in the sidebar menu.
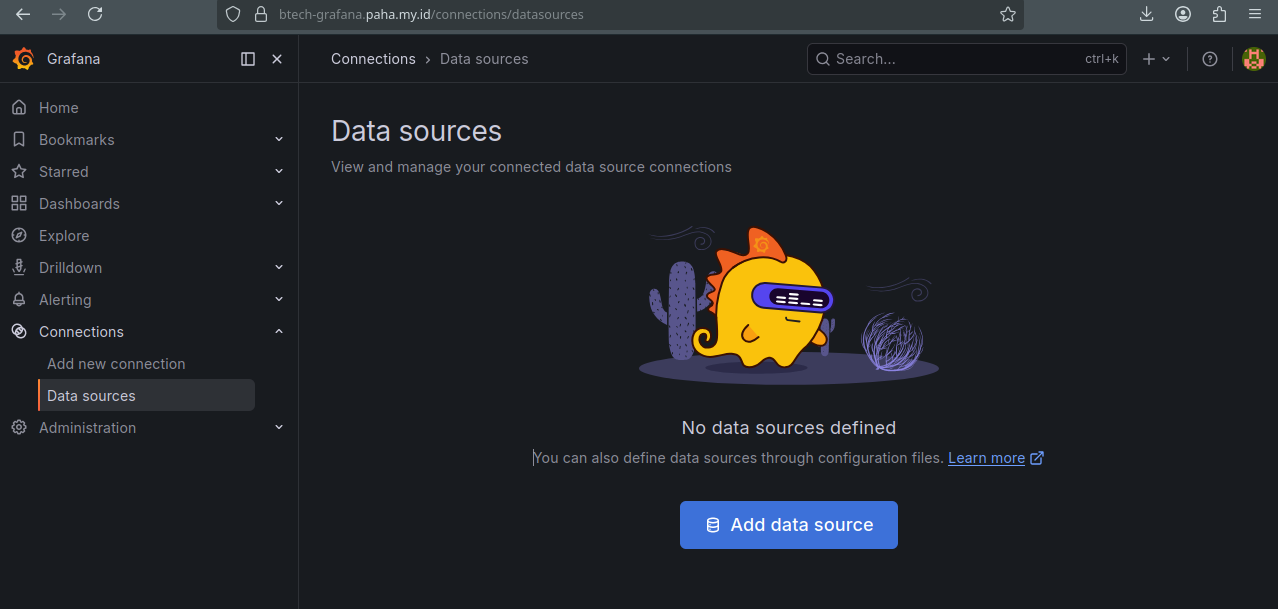
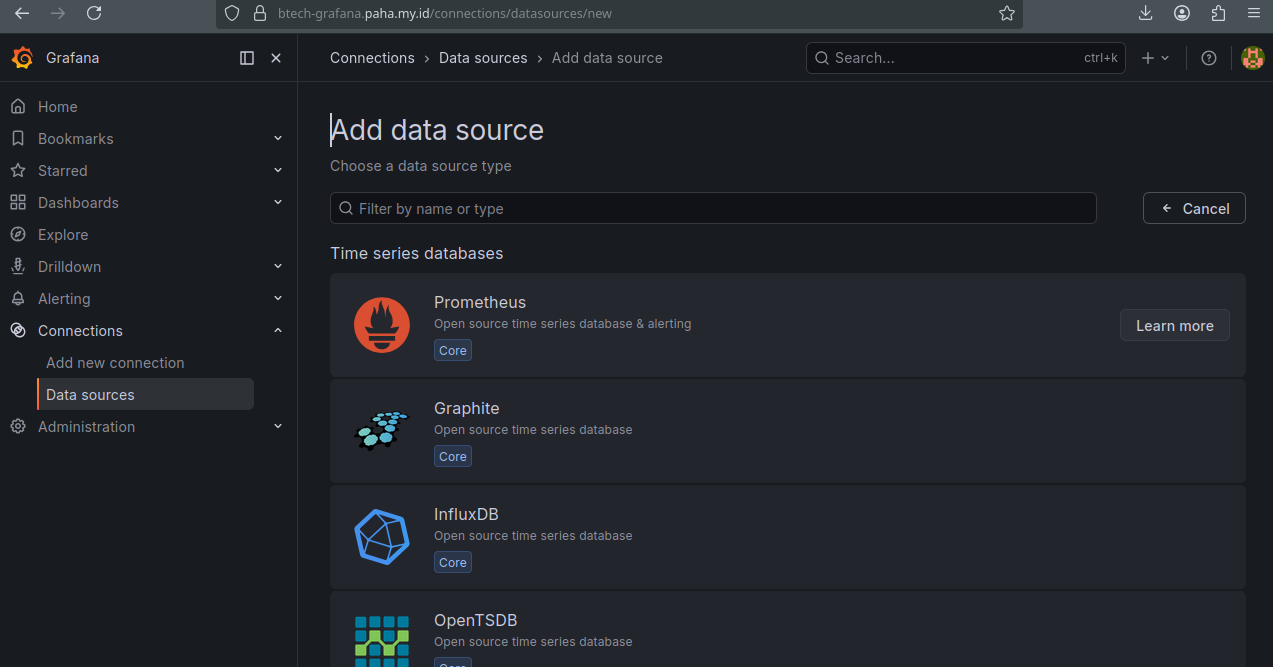
- Click on Add data source and select Prometheus.
- Configure the Prometheus server URL (e.g.,
http://localhost:9090).
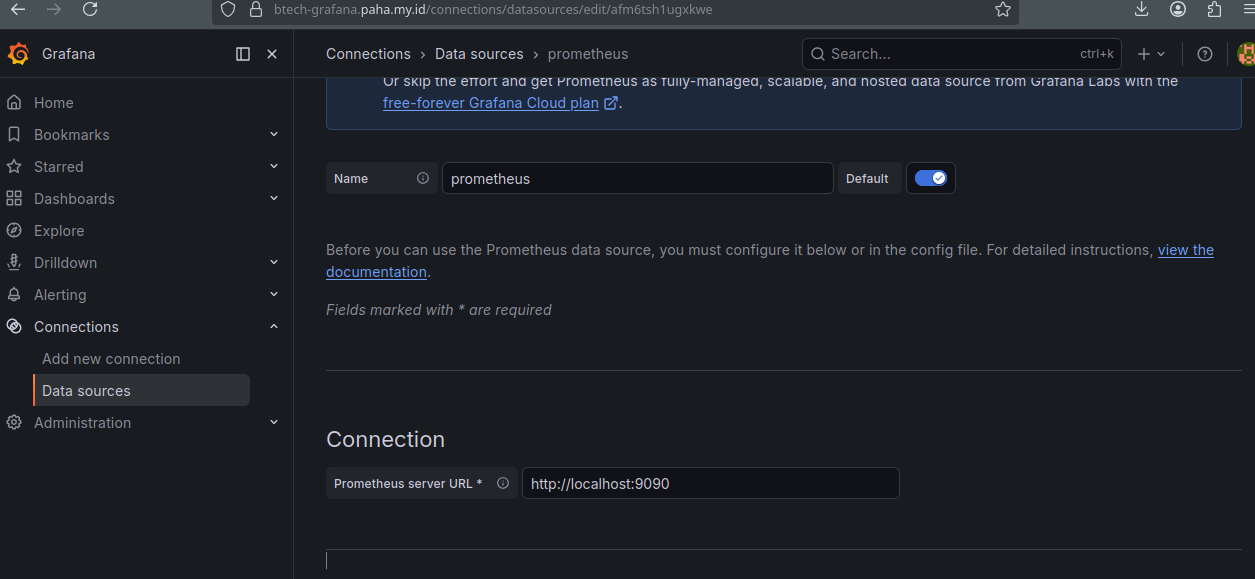
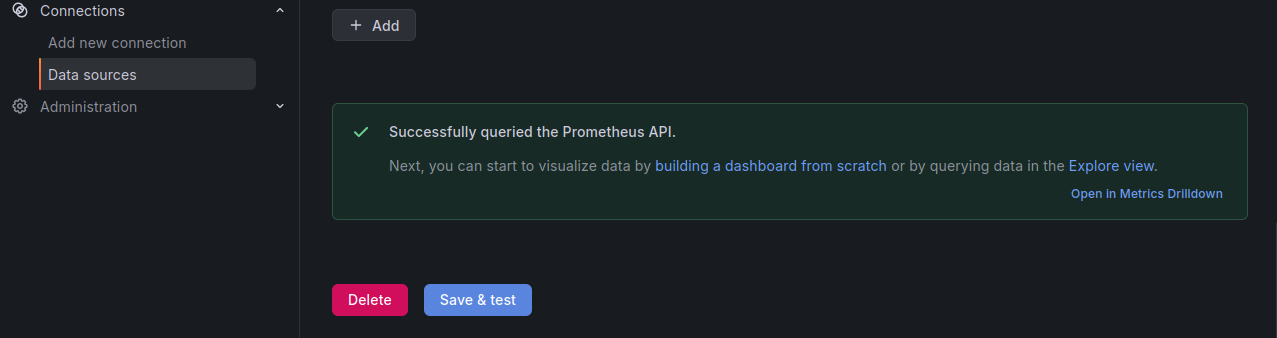
- Scroll to the bottom and click Save & test. You should see a green confirmation message.
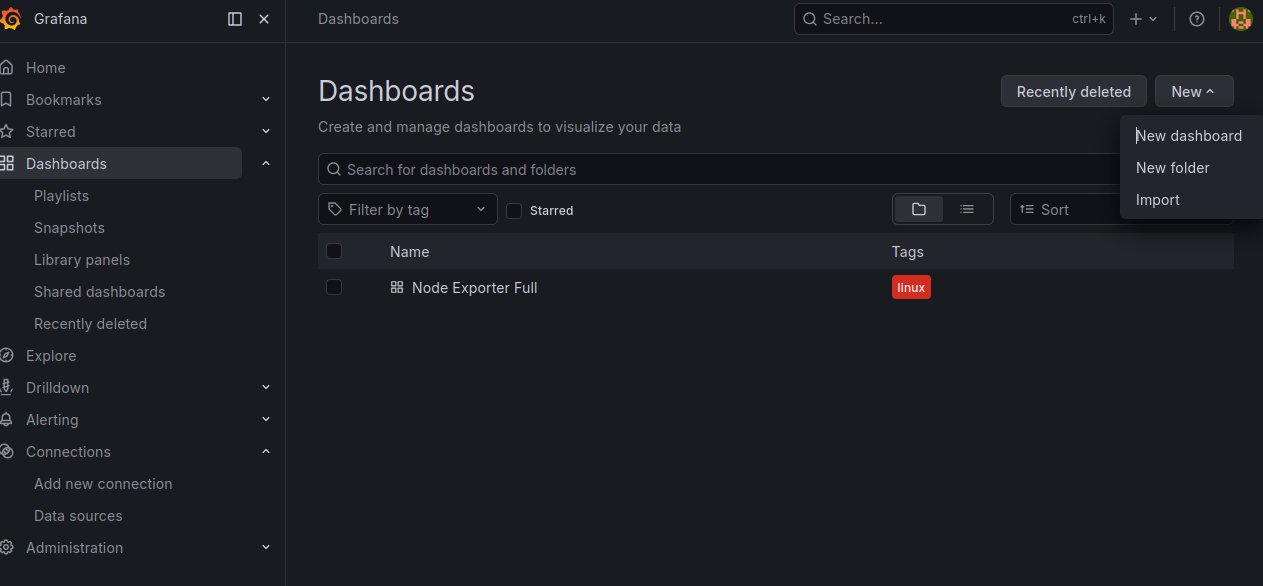
2. Import Node Exporter Dashboard
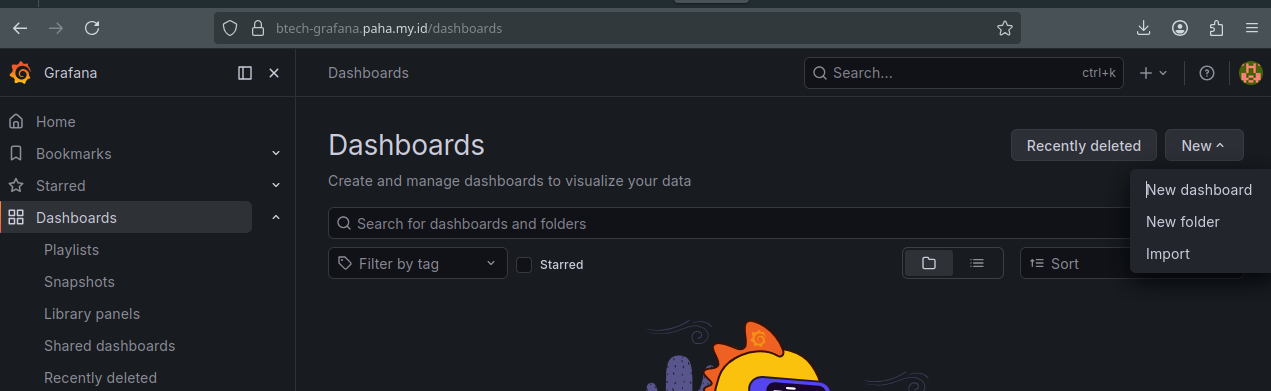
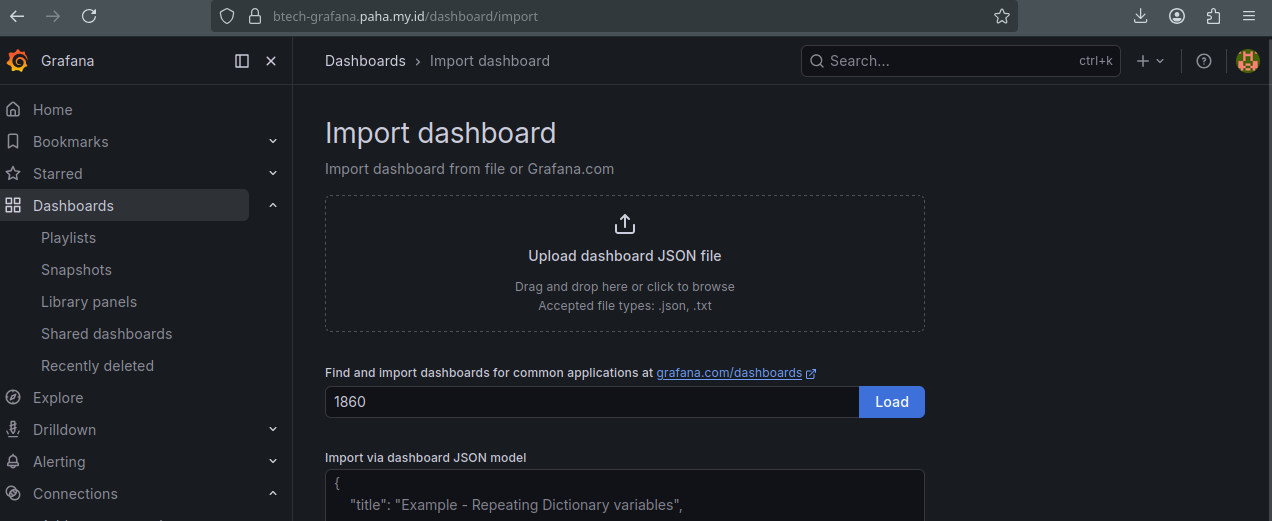
- Navigate to the Dashboards menu and select Import.
- Enter the Official Dashboard ID
1860(Node Exporter Full) and click Load.
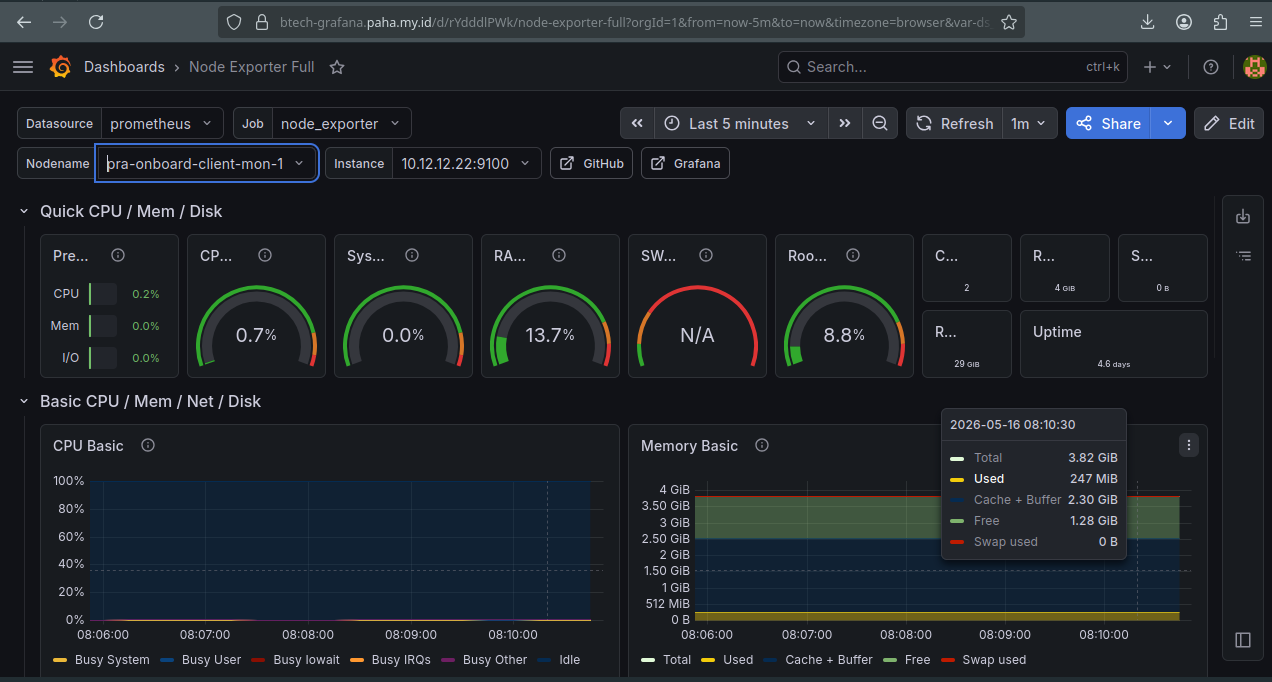
- Select your Prometheus data source from the dropdown and click Import.
B. Loki
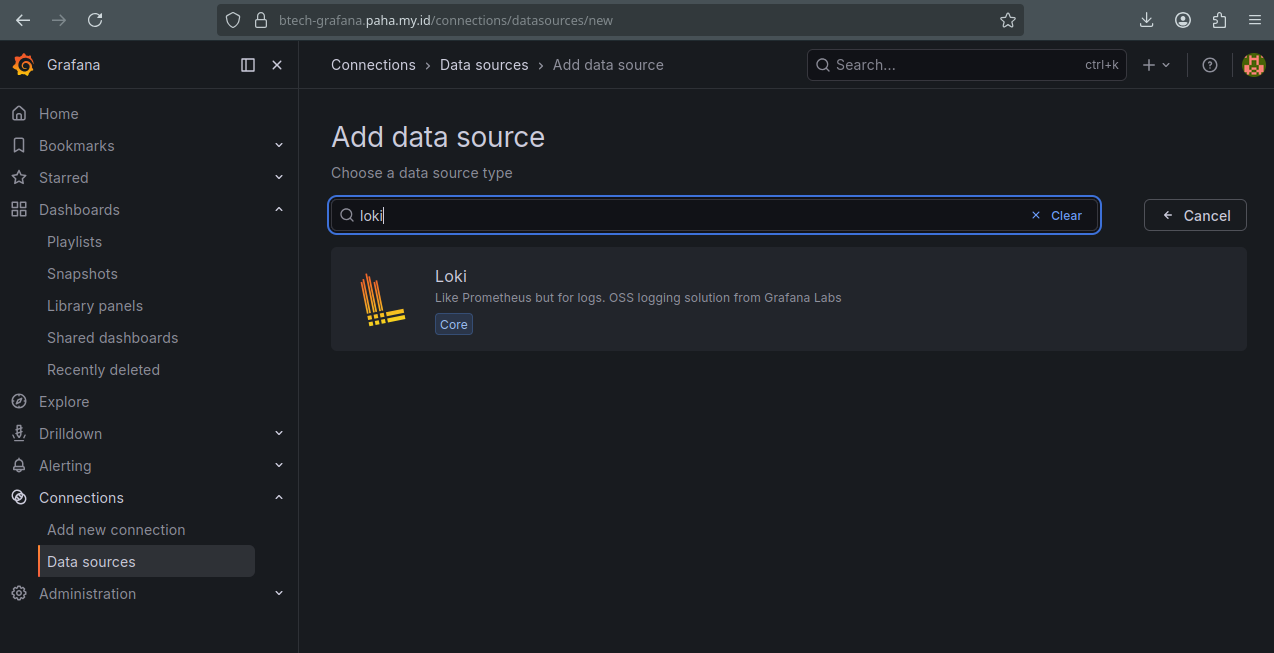
1. Add Loki Data Source
- Navigate to Connections > Data Sources and click Add new data source.
- Search for Loki and select it from the list.
- Configure the Loki server URL (e.g.,
http://localhost:3100).
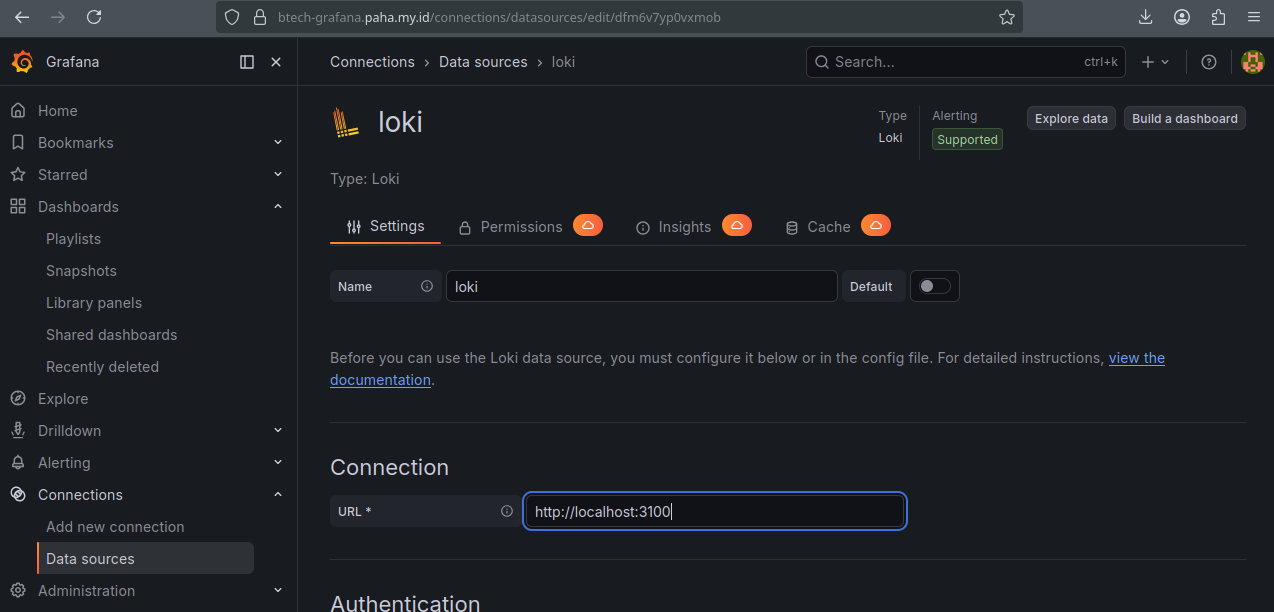
- Click Save & test at the bottom to verify the connection.
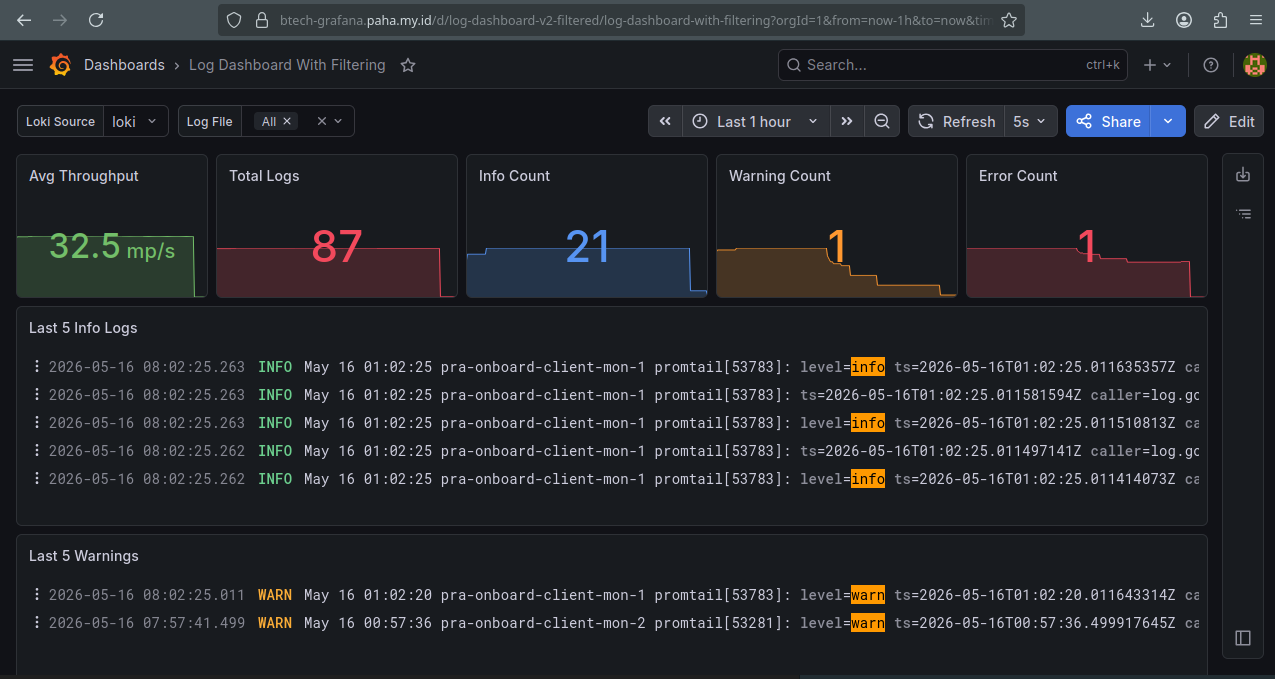
2. Import Loki Dashboard
- Navigate to Dashboards > Import.
- Enter the Dashboard ID
24978and click Load.
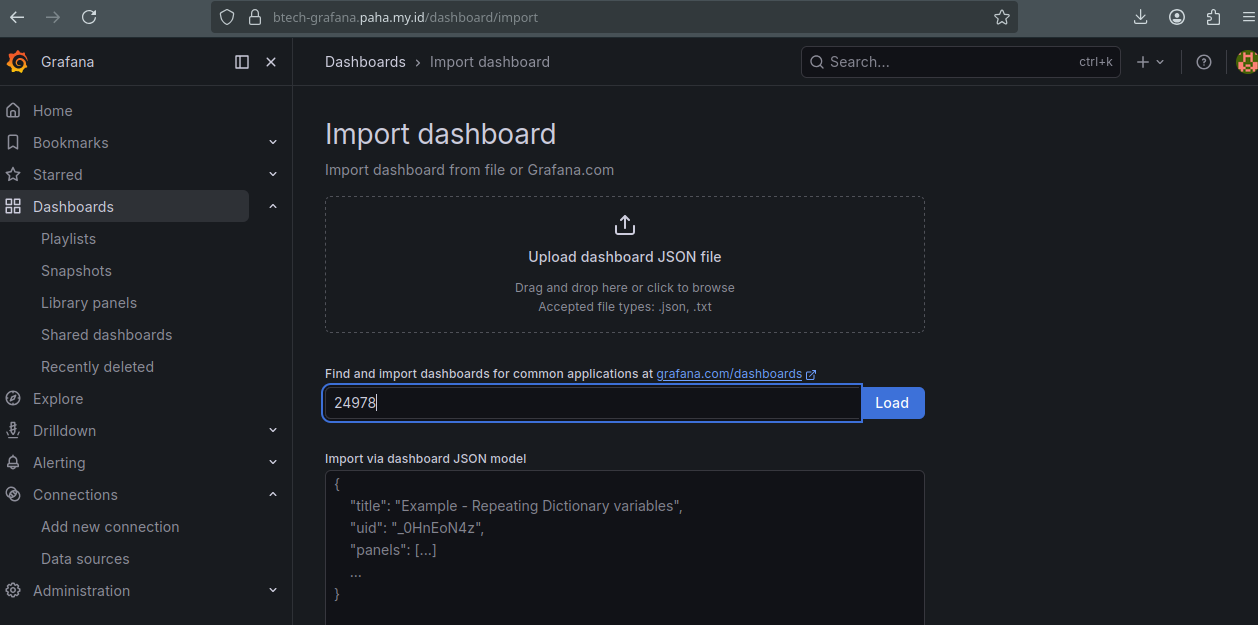
- Select your Loki data source from the dropdown and click Import.
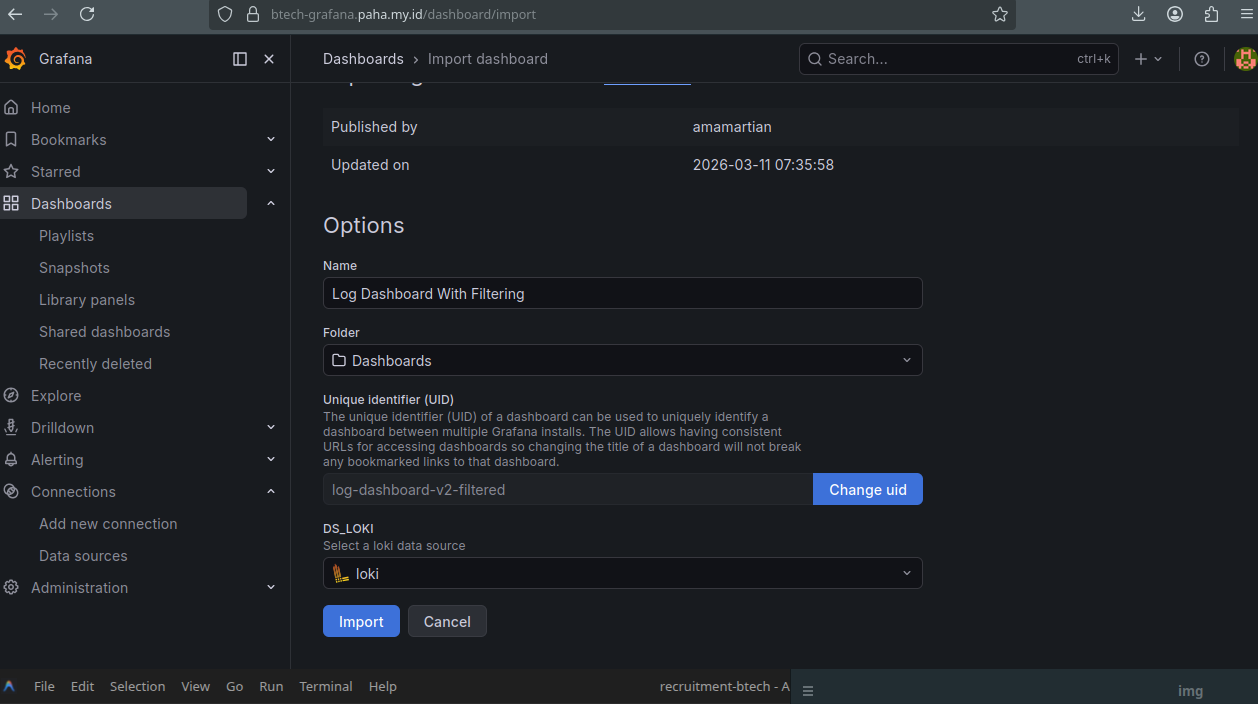
- Your logs will now be visualized in the final Loki dashboard.