Grafana Promtail Installation Guide
Deploy the Promtail log agent on target client machines to ship local logs to the central Loki aggregator. These steps should be executed on both client nodes:
- Client 1:
10.12.12.22 - Client 2:
10.12.12.23
Execute the following steps to install and configure Promtail (version 3.6.8) to scrape and securely ship local log files into your authenticating Loki gateway.
1. Create System User & Assign Group Permissions
To ensure Promtail can read secure system-level log files (such as /var/log/syslog or /var/log/auth.log), the sandboxed user must be added to the Linux adm group:
create user:
sudo useradd --no-create-home --shell /bin/false promtail
assign group:
sudo usermod -aG adm promtail
2. Download & Extract Binary
Install standard processing utils, and retrieve the official binary payload:
install unzip:
sudo apt-get update && sudo apt-get install -y unzip
download promtail:
wget https://github.com/grafana/loki/releases/download/v3.6.8/promtail-linux-amd64.zip
unzip promtail:
unzip promtail-linux-amd64.zip
output:
Archive:  promtail-linux-amd64.zip
  inflating: promtail-linux-amd64
stage binary:
sudo mv promtail-linux-amd64 /usr/local/bin/promtail
set permissions:
sudo chown promtail:promtail /usr/local/bin/promtail
cleanup:
rm -f promtail-linux-amd64.zip
3. Scaffold Data & Configuration Folders
Prepare configurations structures and sandboxed tracking databases (positions):
create directories:
sudo mkdir -p /etc/promtail
sudo mkdir -p /var/lib/promtail
set directory permissions:
sudo chown promtail:promtail /etc/promtail
sudo chown promtail:promtail /var/lib/promtail
4. Configure Logs Scraper
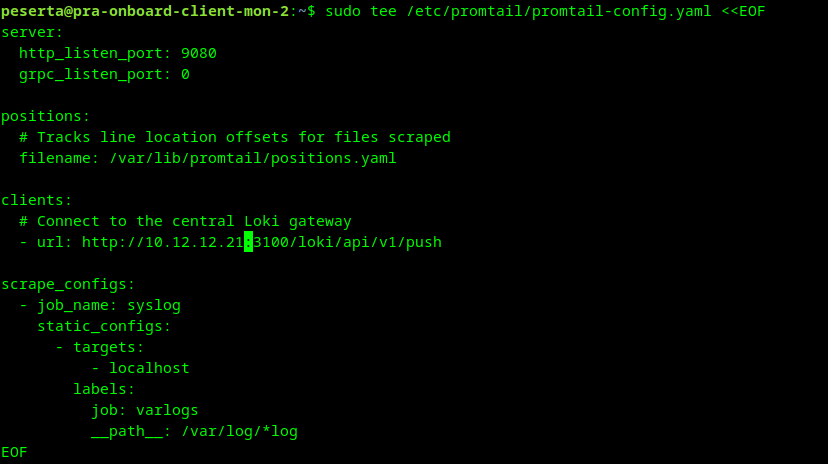
Create the Promtail scraping logic in /etc/promtail/promtail-config.yaml. Ensure you replace <LOKI_GATEWAY_IP> with your central Loki management host IP address, and configure the Basic Auth credentials to match your Nginx gateway setup:
create config file:
sudo tee /etc/promtail/promtail-config.yaml <<EOF
server:
  http_listen_port: 9080
  grpc_listen_port: 0

positions:
  # Tracks line location offsets for files scraped
  filename: /var/lib/promtail/positions.yaml

clients:
  # Connect to the central Loki gateway
  - url: http://<LOKI_GATEWAY_IP>:3100/loki/api/v1/push

scrape_configs:
  - job_name: syslog
    static_configs:
      - targets:
          - localhost
        labels:
          job: varlogs
          __path__: /var/log/*log
EOF
Example:
set config permissions:
sudo chown promtail:promtail /etc/promtail/promtail-config.yaml
sudo chmod 600 /etc/promtail/promtail-config.yaml
5. Systemd Service Unit Definition
Define process supervisions:
create service file:
sudo tee /etc/systemd/system/promtail.service <<EOF
[Unit]
Description=Grafana Promtail log shipper
Wants=network-online.target
After=network-online.target

[Service]
User=promtail
Group=promtail
Type=simple
ExecStart=/usr/local/bin/promtail -config.file=/etc/promtail/promtail-config.yaml
Restart=always
LimitNOFILE=65536

[Install]
WantedBy=multi-user.target
EOF
6. Start & Enable Promtail
Bootstrap the aggregator:
reload systemd:
sudo systemctl daemon-reload
start service:
sudo systemctl start promtail
enable service:
sudo systemctl enable promtail
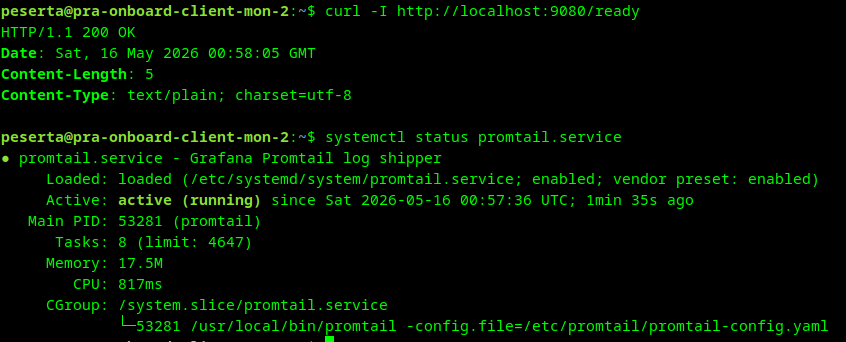
Verification
Ensure the agent running loop responds correctly:
check service status:
sudo systemctl status promtail
output:
Expected Warnings
If you start Promtail before the central Loki gateway is fully configured and reachable, you will observe connection warnings in the logs. This is expected behavior as the agent attempts to establish its initial push connection.
check logs:
journalctl -u promtail -n 20 --no-pager
output:
May 15 23:20:17 pra-onboard-client-mon-1 promtail[53527]: level=warn ts=2026-05-15T23:20:17.862808578Z caller=client.go:419 component=client host=10.12.12.21:3100 msg="error sending batch, will retry"
May 15 23:20:19 pra-onboard-client-mon-1 promtail[53527]: level=warn ts=2026-05-15T23:20:19.475864169Z caller=client.go:419 component=client host=10.12.12.21:3100 msg="error sending batch, will retry"