c. Monitoring Utilization
Once your monitoring infrastructure and client agents are fully deployed, you can analyze real-time resource utilization and log streams across your entire server fleet.
Monitoring Architecture
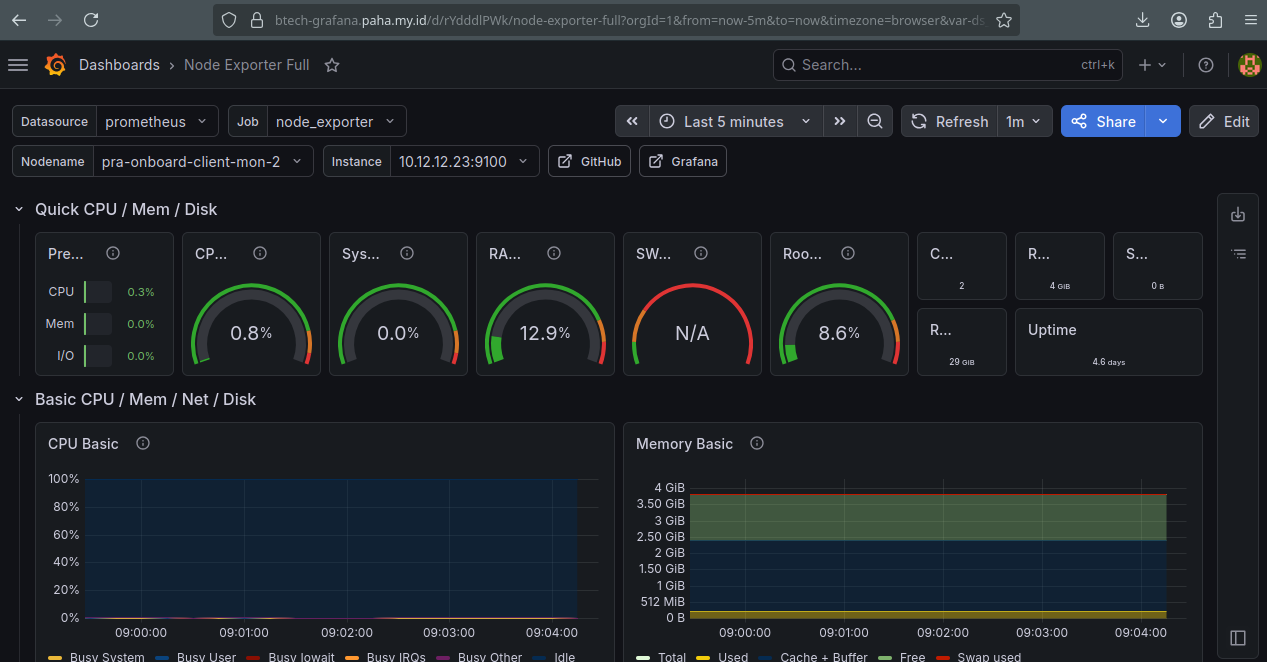
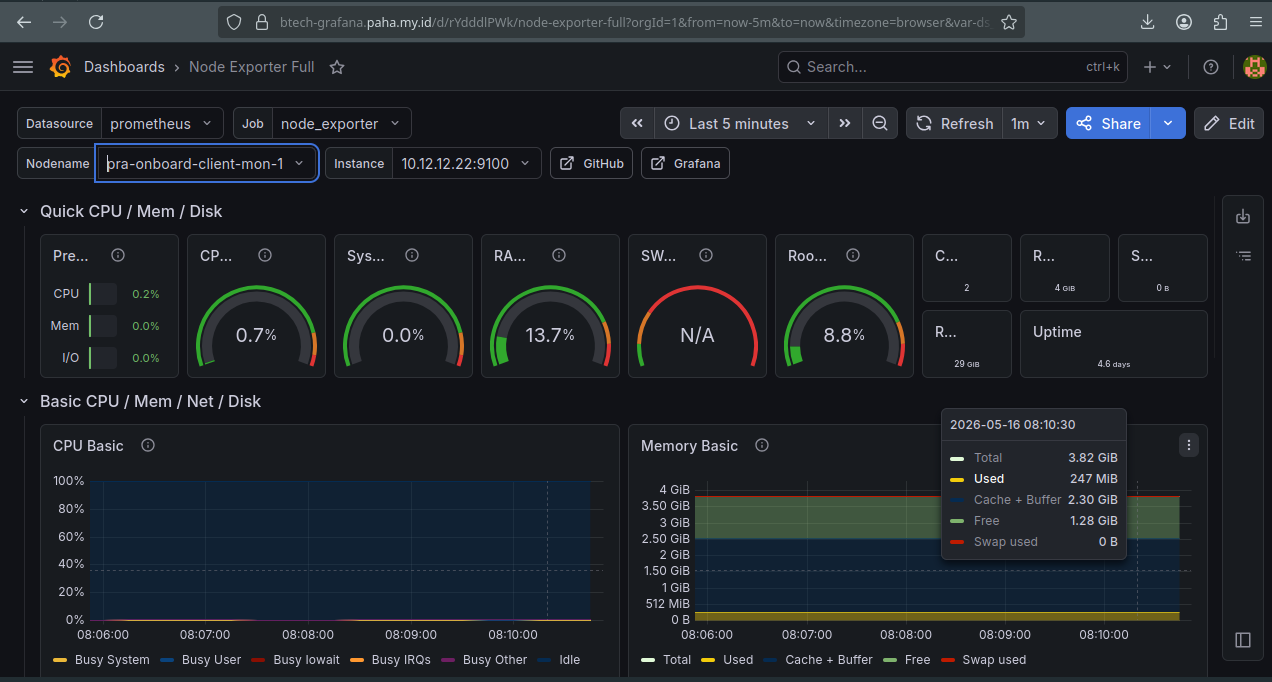
1. Node Exporter Metrics
The Node Exporter dashboard provides deep visibility into the hardware health of your target systems. You can monitor CPU load, memory pressure, disk I/O, and network throughput for each individual host.
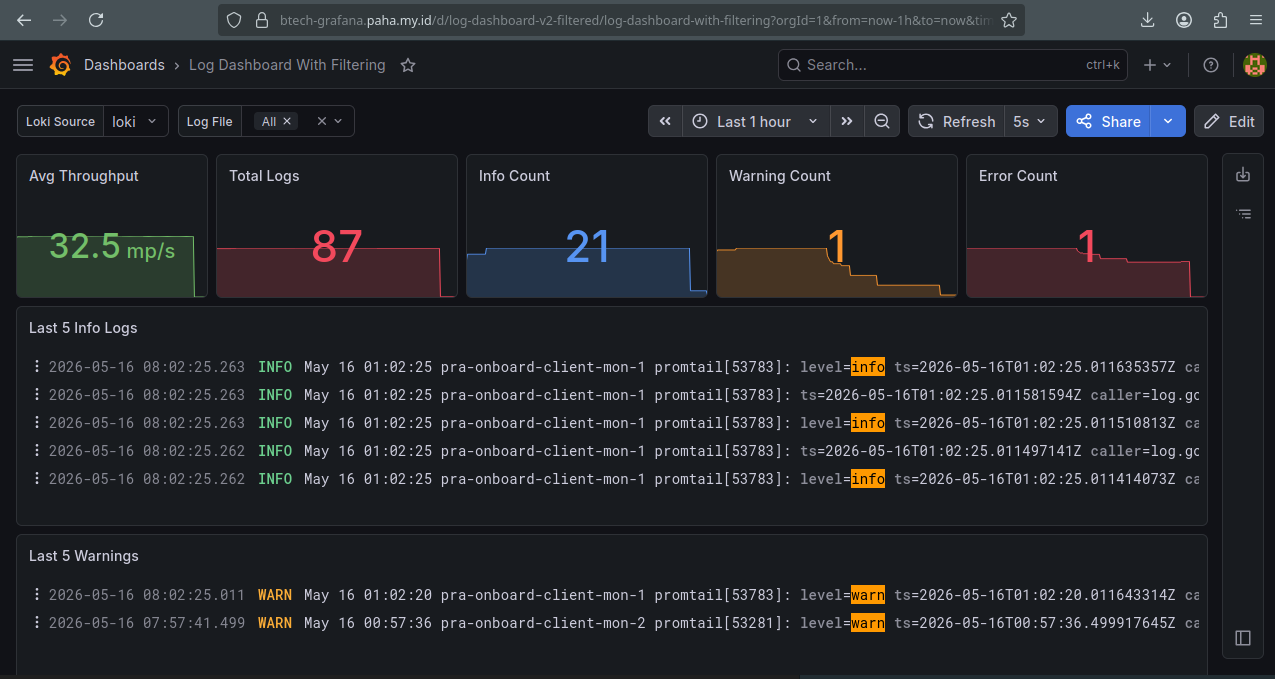
2. Loki Log Analysis
The Loki dashboard aggregates log streams from all your clients via Promtail. This allows you to query logs across multiple services, filter by labels, and identify operational errors or trends without accessing the target servers directly.