Execution & Monitoring
Combine all stress factors into a single 2-minute benchmark and observe the results via the centralized monitoring server.
Benchmark Monitoring Topology
1. Combined Benchmark Command
To perform a holistic stress test on the client nodes, execute the following combined command:
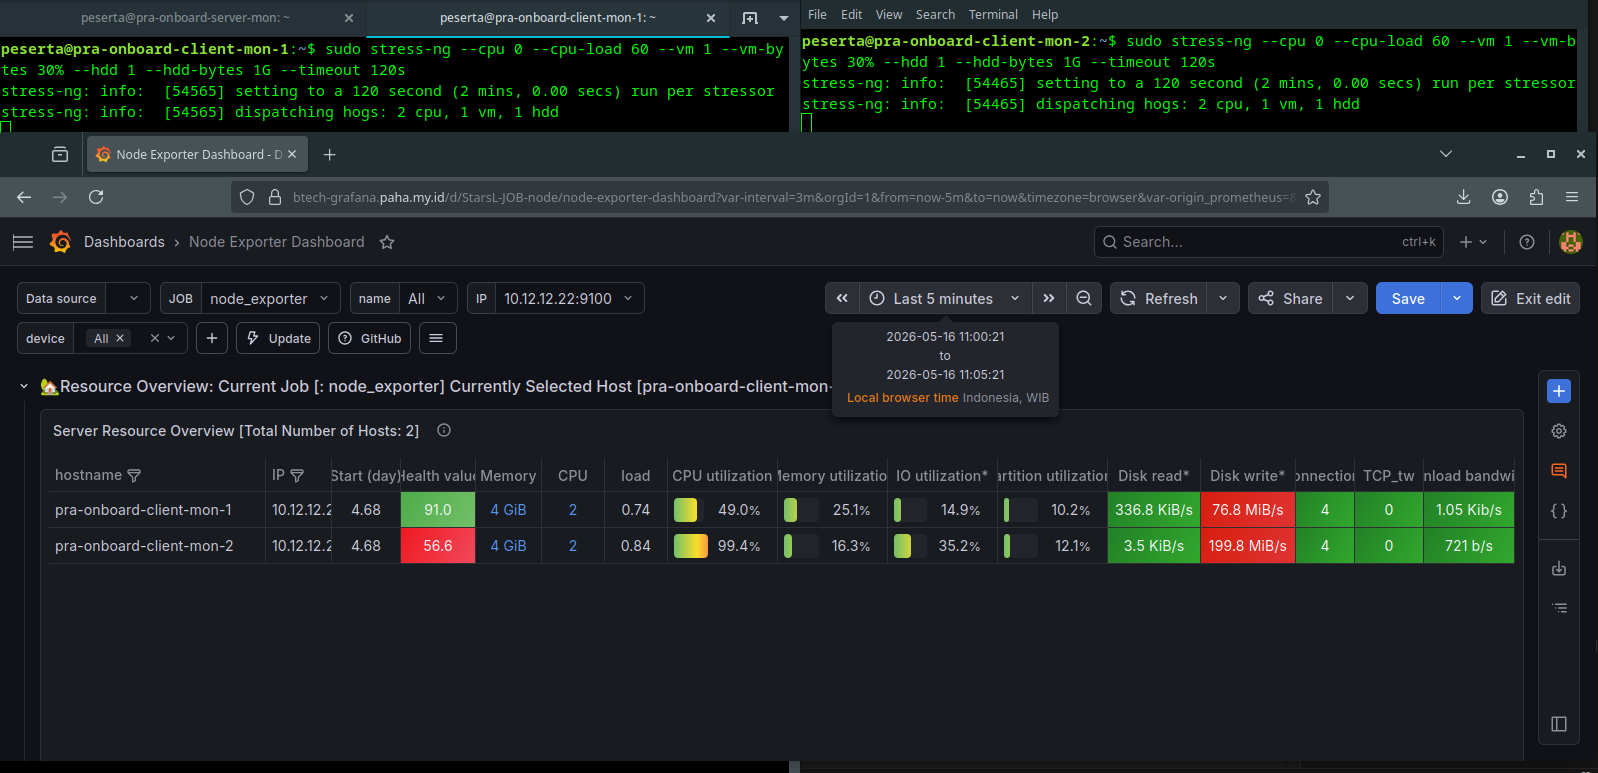
sudo stress-ng --cpu 0 --cpu-load 60 --vm 1 --vm-bytes 30% --hdd 1 --hdd-bytes 1G --timeout 120s

2. Server-Side Monitoring
While the benchmark is running on the clients (10.12.12.22 and 10.12.12.23), navigate to the Server Monitoring (Grafana) dashboard to verify the utilization spikes:
- Open Grafana Dashboard.
- Select the Node Exporter Full dashboard.
- Observe the CPU, Memory, and Disk I/O graphs during the 120-second window.
warning
Ensure that the Node Exporter and Promtail agents are active on the clients to capture the performance data during the test.